


Solar Panel Wind Stow Angle: What Wind-Tunnel Tests Reveal About Single-Axis Tracker Safety Ⅱ
- Beyond the Critical Point: Amplitude Flips All the Way to 90°
Take the 0° initial-tilt load case to see how the instability unfolds. Before the reduced wind speed exceeds 5.23, the root-mean-square (RMS) value of the module torsional angle stays almost on the zero line — small shuddering of only a fraction of a degree, with the mean torsional angle stable near the initial position.
At Ur = 5.23 the curve suddenly bends up — the amplitude jumps with no warning. This is the onset point of aerodynamic instability, and the corresponding incoming wind speed is the critical wind speed. Note that this is not the kind of response that “shakes harder and harder and then settles down”; it is a typical self-excited vibration: once the threshold is crossed, the amplitude is set by the coupling of the system itself with the wind, and the wind only supplies energy.
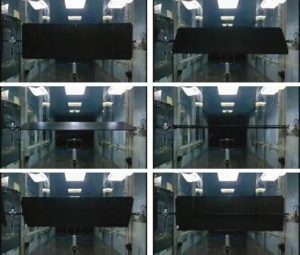
A six-photo sequence of the segment model in the wind-tunnel test section, corresponding to −90°, −60°, −30°, 0°, 60° and 90° torsional positions, directly showing the whole process of the module flipping from near-horizontal to near-vertical during large-amplitude aerodynamic instability.
Continuing to increase the wind speed, the torsional amplitude keeps growing, while the mean torsional angle — that is, the equilibrium position of the vibration — stays unchanged, identical to that in the onset phase. This detail is important: instability does not blow the panel to some new angle and settle there, but makes it swing ever wider about the original equilibrium point.
Once the reduced wind speed exceeds 6.57, the laser displacement gauges have exceeded their range and can no longer measure the full torsional process, so the test switched to video analysis to capture the wind-induced vibration features. At Ur = 6.86 the maximum torsional amplitude of the model made it fully vertical — that is, 90°.
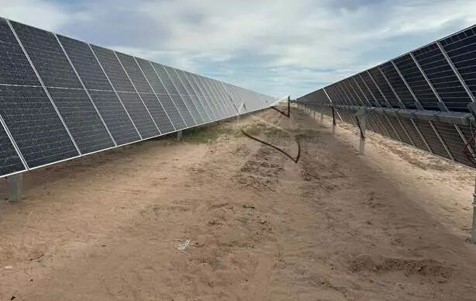
What does 90° mean? The module becomes a wall perpendicular to the ground. At this angle, the clamps connecting the frame to the torque tube, the bolts, the drive arms, and the connection nodes between posts and foundations are all carrying loads that are not the design load combinations. The arrays in site photos — twisted upright, with twisted frames and detached modules — have followed exactly this path.
The test successfully reproduced the phenomenon in which a real single-axis tracker suffers aerodynamic instability with an amplitude near 90°, which in turn validates this pure-torsion test method — being able to measure to 90° shows the suspension system really did keep a linear restoring force under large deformation, without distortion.
As a control, the 45° initial-tilt load case is entirely different. Over the whole range where the reduced wind speed is below 10, the mean and RMS of the torsional angle only increase gently with wind speed, and the sudden RMS jump of the 0° case never appears, indicating that the system did not undergo aerodynamic instability. This is fully consistent with the W curve’s conclusion that “41°–60° is a stable zone” (with due regard to static displacement, see Section 5).
- The Overlooked Static Wind Displacement: The Real Instability Zone Is Wider
If one looks only at the initial tilt, the conclusion seems clear: stow the tracker beyond ±40° and it is safe. But here hides an easily overlooked intermediate quantity — the static wind displacement.
The tracker is simultaneously subject to two actions: a constant torque from the static wind load, and a self-excited torque from the aeroelastic effect. As the module tilt increases and wind speed rises, the static wind moment keeps growing and the module is “pushed” to a new angle; this deflection is called the static wind torsional displacement. Whether instability occurs depends on the actual tilt at that moment, not on the initial tilt commanded by the motor.
The 45° load case exposes this thoroughly. When the reduced wind speed reaches 10, the torsional angular displacement of the module under the static wind load is already close to 30°, and its actual tilt reaches 75°. That is, commanded to stow at 45°, once the wind blows the panel has actually stood up to 75°.
Re-organising all load cases by actual tilt, the instability interval expands from −39° to 40° in the initial sense to −43° to 46° in the actual sense: 4° extra in the negative direction, 6° extra in the positive direction, the total span growing from 79° to 89°, the extra 10° coming entirely from static wind displacement.
This 10° is not a small number in engineering. If a plant sets its gale-protection stow at 42° — by the initial sense it lies in the “stable zone”, but once static wind displacement is considered, the actual tilt may already have entered the −43° to 46° instability boundary. The safety margin of the protection angle must explicitly deduct this static wind displacement term.
Another rule is worth remembering: after instability occurs, the equilibrium point of the torsional vibration is exactly the actual tilt under the static wind load during the onset phase. In other words, static wind displacement not only deflects the panel by an angle — it also redefines the position about which the vibration diverges. When assessing the ultimate positions of modules, frames, clamps and posts, one should use this actual equilibrium point as the reference, not the commanded angle reported by the motor.
A methodological pitfall was also found during the test: static-friction locking of the bearings. This system uses bearings to restrain the translational displacement of the structure, and bearing friction is the main source of system damping. When the model is at rest there is static friction between the bearings, whose coefficient exceeds kinetic friction; the larger the module tilt, the larger the aerodynamic force, so the pressure between the bearings rises and the friction rises too.
Per structural dynamics, the effect of friction is equivalent to Coulomb damping, characterised by the larger the amplitude, the smaller the equivalent damping ratio. Thus an illusion appears: a resting model is “locked” by static friction and should have gone unstable but did not. Once an external perturbation is applied, static friction turns into kinetic friction, the equivalent damping drops sharply, and wind-induced vibration occurs immediately. The instability interval obtained from earlier tests without perturbation was too small; only after adding perturbation did it expand to −39° to 40°.
This also explains a long-standing divergence in the literature: for the same segment-model test, the aerodynamic-instability tilt interval measured under turbulent conditions is larger than under uniform flow. The reason is that turbulence itself keeps the model buffeting, effectively removing the static-friction lock automatically. For test data, uniform-flow results are more conservative and turbulent results more realistic; when making design values one must know which flow field the data came from.
- How to Set the Wind Stow Angle: A Two-Objective Trade-Off
Looking at the three groups of conclusions together, the gale-protection stow angle is really a two-objective trade-off. One objective is to stay clear of the aerodynamic-unstable zone; the other is to prevent static wind torque from eating up the structural capacity. The two tug against each other, and there is no free stow position.
Laying flat (0°) is the most common practice. Test data show it really sits at the position of highest critical wind speed within the instability zone (Ur = 5.3, about 13 m/s), but “highest” does not equal “will not”. Under gust or turbulent conditions, wind speeds briefly exceeding 13 m/s are common; once the critical point is crossed, the amplitude grows rapidly. Treating flat-horizontal as absolutely safe is the biggest misreading of this data set.
Figure 6: The two-dimensional trade-off of gale-protection stow — horizontal axis is the stow initial tilt, vertical axis is the relative static wind torque vs. horizontal; green dots are aerodynamically stable, red dots are aerodynamically unstable; avoiding the −39° to 40° instability zone means accepting a larger static wind torque.
Stowing at a large tilt (±45° to 60°) is aerodynamically stable — in the test, no instability appeared even when the reduced wind speed was raised to 20, equivalent to about 49 m/s on the prototype, close to a strong typhoon. But the cost is the largest static wind torque: the 45° load case already has a static wind displacement near 30° at Ur = 10, pushing the actual tilt to 75°. Such a large static wind torque presses directly on the drive unit, slew bearing and connection nodes. Choosing this stow requires simultaneously checking the load capacity of the drive and bearing.
What should be avoided most is the twenty-something-degree intermediate posture. It neither escapes the instability zone nor avoids the trough of the W curve, with a critical wind speed only 58% of that at 0°. And it is exactly this kind of “want both power generation and wind protection” compromise angle that is quite common in real operating strategies.
From this we can distil several actionable judgements. First, the gale-protection stow angle cannot be judged by the initial angle alone — it must be converted into the actual tilt after static wind displacement. Second, if a large-tilt stow is used, the drive and bearing margins under static wind torque must be re-checked. Third, avoid using an intermediate tilt as a long-term gale-parking posture. Fourth, the damping ratio is a key variable: the present results correspond to 3.9%, and if a real tracker loses damping due to wear, icing or changes in lubrication, the critical wind speed will drop even further.
There is one more easily overlooked layer: array effects. The test measured a single-row segment model, while a real plant has tens or hundreds of rows tightly arranged. The wake of the upstream array changes the turbulence intensity and mean wind speed of the downstream inflow, and turbulence is precisely what removes the static-friction lock and widens the instability interval. This means the stability boundary from a single-row test must be further discounted in multi-row arrays.
From an industry standpoint, the structural design of tracker supports has long been driven by equipment manufacturers; wind-load values mostly still follow the fixed-mount mindset, with insufficient coverage of aeroelastic instability as a self-excited phenomenon. Writing the W curve, the static-displacement expansion, and the sensitivity to turbulence and damping into selection and O&M procedures is more targeted than simply raising a safety factor.
This carbon-fiber plate in the wind tunnel, twisted from horizontal to vertical by stepwise wind speed, has clarified the cause of many site failures: it is not that the wind was too strong, but that the tracker was parked at an angle that let the wind keep doing work.
For plants that have already installed trackers, and those about to, what really needs changing is not just the number of that “gale stow angle”, but the whole mindset — converting the angle into an actual tilt, converting a single row into an array, and converting static wind pressure into aeroelasticity.
The end.