


Solar Panel Wind Stow Angle: What Wind-Tunnel Tests Reveal About Single-Axis Tracker Safety Ⅰ
Key Takeaways (Quick Answer)
- The wind stow angle is not automatically safe just because it is “flat”. Flat-horizontal (0°) sits at the edge of the aerodynamic-instability zone.
- The most dangerous stow angle is about 20° — the lowest point of a “W-shaped” critical-wind-speed curve.
- At 20° a single-axis tracker can start galloping in only a Force-4 breeze (~7.6 m/s); 0° needs about 13 m/s (Force 6).
- Steep angles (beyond roughly ±40–45°) are aerodynamically stable but impose the largest static wind torque on drives and bearings.
- Always convert the commanded stow angle into the actual tilt after static wind displacement — the real instability zone is wider than it looks.
Note: The text below is an SEO-optimized English translation of the original Chinese technical article. All numerical results, figure references and technical conclusions from the source are preserved.
Introduction: The “Safety Angle” That Can Kill a Tracker
The instruction manuals of nearly every single-axis tracker contain the same life-saving line: before a strong wind arrives, rotate the modules into a safe stow position. Many power plants assume by default that this safe position means laying the modules flat — panel face up, wind skimming over the top, which looks the most docile. Yet after a strong gale, the site photos often show something else entirely: entire rows of modules twisted into near-vertical “blades”, with posts twisted, frames deformed and torque tubes misaligned.
This is not the wind “blowing the panels over”; it is aerodynamic instability. The structure itself draws wind energy in, the vibration grows larger and larger, and finally the amplitude becomes uncontrollable. In bridge engineering this is called flutter — the number-one enemy of suspension-bridge design; in the photovoltaic industry, aerodynamic instability of tracker supports has long been handled with rules of thumb and manufacturer datasheets, and what is missing is refined, full-tilt-range measured data.
A set of 1:6 scaled segment-model wind-tunnel tests quantified this problem to the degree. The test increased wind speed step by step from zero in a uniform flow, sweeping the module tilt angle from −60° to 60° at 5° per load case, and adding five supplementary points in the critical region at −37°, −38°, −39°, 41° and 42°. The conclusion is quite counter-intuitive: the instability interval is −39° to 40°, and the curve of critical wind speed against tilt angle is a W shape.

Figure 1: A three-frame field sequence — a row of single-axis trackers twisted progressively upright by strong wind, from a gentle tilt all the way to near-vertical, which is the real process of rapid amplitude growth once aerodynamic instability occurs.
A W shape implies something deadly: within the instability zone the most resistant angle is 0° and the least resistant is 20°. The non-dimensional reduced critical wind speed is largest at 0°, equal to 5.3, and smallest at 20°, only 3.1. Scaling these two numbers back to a real plant via similarity relations, 0° starts oscillating at roughly 13 m/s, while 20° needs only 7.6 m/s — that is a Force-4 breeze.
In other words, the flat-horizontal position widely treated as a “life-saving stow” actually still stands at the doorway of the instability zone — just on the sturdiest brick at that doorway; whereas the twenty-something-degree intermediate posture that some plants adopt to balance power generation and wind protection steps precisely on the most fragile point of the whole interval.
- One Rotating Axis Turns a Solar Panel into a Rudder Surface
A fixed mount is welded or bolt-locked to its posts: it is a static structural member, and no matter how large the wind pressure it is only a load. A single-axis tracker is different: the modules rotate about a horizontal north–south torque tube, and this axis is both the degree of freedom for power generation and the degree of freedom for instability. Once the wind moment couples with this rotational degree of freedom, the structure can switch from “resisting the wind” to “feeding on the wind”.
Look first at the dynamic properties of this system. A finite-element modal analysis of the actual prototype gives a first torsional mode frequency of 1.169 Hz and a first vertical-bending mode frequency of 2.755 Hz. The torsional frequency is only 42% of the vertical-bending one. This ratio determines the shape of the instability: when the structure wants to move, the first thing to move is its “softest” direction — torsion about the torque tube, not vertical up-and-down bending.
Field observations of real projects confirm this — when a tracker suffers aerodynamic instability, what you see on site is the panels rotating, not shuddering. The wind-tunnel test therefore made a key simplification: ignoring the vertical-bending mode and keeping only the torsional mode, reducing the problem to a single-degree-of-freedom aeroelastic system.
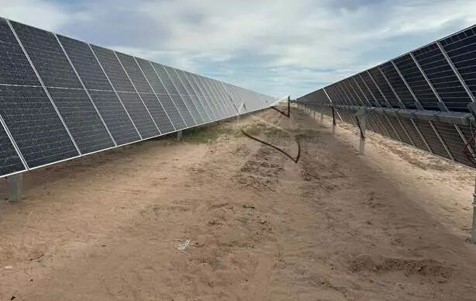
Figure 2: Rows of single-axis trackers laid out on sandy ground; shot from between two rows, the continuous torque tube, braced posts and module tilt are visible. The rotational degree of freedom of this structure is both the source of power generation and the source of aerodynamic instability.
The prototype under test is a very typical engineering configuration: a single row 63.36 m long in total, 10 posts per row, maximum post spacing of 7.4 m, with the drive column placed at the mid-span of this single row. The modules are conventional large-format bifacial glass units of 2094 mm × 1038 mm × 35 mm, each weighing 27.5 kg.
The single horizontal axis carrying these modules is a hollow square tube with 100 mm side length and 2.85 mm wall thickness; a 45 mm clear gap is left between the tube and the modules; the posts use U-shaped steel, 160 mm high, 80 mm wide, 3 mm wall thickness. Remember these numbers — a 100 mm hollow square tube has to drive a whole row of over sixty metres of modules to rotate into the wind, and its torsional stiffness is the first weak point of the entire system.
The aerodynamic shape of a single-axis tracker is essentially no different from a thin flat plate. A thin flat plate undergoing large-amplitude torsional vibration in an airflow is one of the most classic and most intractable problems in aeroelasticity: it has neither the well-developed flutter-derivative framework of a bridge cross-section, nor an aeroelastic framework as ready-to-copy as a wing. The PV industry has mostly borrowed flat-plate results and relied on safety factors as a backstop.
- A 1:6 Carbon-Fiber Model, and a Rig Purpose-Built for Large-Amplitude Torsion
A wind tunnel cannot fit the entire sixty-metre row, so only a segment model is possible. The geometric scale ratio of this test was taken as 1:6. It sounds simple — just divide the dimensions by six. The difficulty is that mass and stiffness must satisfy the similarity laws simultaneously.
The module panels were reproduced with 1 mm-thick carbon-fiber sheets, the frames with 5 mm- and 2.5 mm-thick carbon-fiber strips, and the single axis with a carbon-fiber hollow square tube of 16 mm side length and 3 mm wall thickness. The model simulates 6 modules in total, 1200 mm long overall; each module is 349 mm long and 173 mm wide with a mass of only 0.128 kg. To eliminate end effects, transparent fairing plates were fitted at both ends of the model.
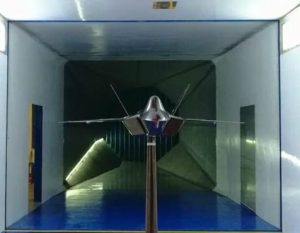
Figure 3: The interior of the wind-tunnel test section — the model is held at the centre of the airflow by its support rig, with the contraction section visible downstream. Tracker segment models have their critical points measured by step-by-step wind-speed increases in exactly such a test section.
According to the numbers in the table: the prototype equivalent mass is 41.13 kg/m while the model is only 1.12 kg/m — about a 37-fold difference; the mass moment of inertia drops from 11.2000 kg·m²/m to 0.0088 kg·m²/m — about a 1270-fold difference; the module gap is also scaled from 0.0100 m to 0.0016 m. Adjustments of this magnitude rely on the high specific stiffness of carbon fiber and repeated counter-balancing.
The second hard part is the suspension system. Traditional segment models use elastic suspension, which is adequate for small-amplitude flutter tests, but tracker aerodynamic instability is large-amplitude torsion — amplitude can reach tens of degrees. Under large deformation the geometric relationship of the springs is no longer linear, torsional stiffness drifts with angle, and the measured critical wind speed becomes unreliable.
A pure-torsion elastic system was therefore designed specifically: composed of a wheel, springs and a fixed frame. The angular displacement of the modules is transmitted through the wheel rotation into vertical spring extension; the torsional stiffness of the system is provided by the spring tensile stiffness. To change the torsional frequency, one only adjusts the static elongation of the springs. This rig keeps a linear torsional restoring force even at large amplitude, which is the prerequisite for testing all the way to 90°.
Free-vibration dynamic tests gave a clear result: under different module tilt angles the torsional frequency stayed stable at 1.758 Hz, with the damping ratio differing slightly and averaging 3.9%. This damping ratio matters a great deal — the critical wind speed of aerodynamic instability is highly sensitive to structural damping; the smaller the damping, the easier the instability. 3.9% is the measured damping level of this model system.
The test was carried out in the high-speed test section, which is 3 m wide, 2.5 m high and 17 m long, with wind speed continuously adjustable from 0 to 60 m/s in a uniform flow. Starting from zero the wind speed was raised slowly; for each load case the displacement time histories at two module points were acquired, and the torsional angle was back-calculated from the symmetrically arranged displacement difference of the two points.
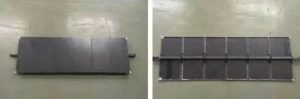
Figure 4: Two real photos of the 1:6 segment model, showing the carbon-fiber panels, the frames reproduced with carbon-fiber strips, the square tube simulating the single axis, and the torque tube passing through the model centre.
- The W-Shaped Curve: Why 20° Is the Most Dangerous Angle
The metric for instability is the non-dimensional reduced wind speed. It bundles three quantities — wind speed, model frequency and characteristic length:
Ur = U / (f × B)
where U is the wind-tunnel incoming wind speed (m/s), f is the model frequency in the wind-tunnel test, taken as 1.758 Hz, and B is the module length in the test, taken as 0.349 m. The advantage of using a non-dimensional quantity is that models with different scale ratios and frequencies can be compared directly, and it is convenient to extrapolate to the prototype.
Plotting all load cases together yields a W-shaped curve. At a structural damping ratio of 3.9%: when the initial module tilt falls in −60° to −40° or 41° to 60°, increasing the reduced wind speed all the way to 20 did not produce aerodynamic instability, and the tracker stayed aerodynamically stable; but when the initial tilt falls within the entire 79-degree interval from −39° to 40°, the system suffered aerodynamic instability.
Even more crucial are the differences within the interval. The non-dimensional critical wind speed is largest at a 0° tilt, equal to 5.3, and smallest at a 20° tilt, only 3.1. That is, for two “unstable” tilt angles, 20° needs only 58% of the wind speed required at 0° to start oscillating.
Converting back to the prototype via similarity relations, using the prototype first torsional frequency of 1.169 Hz and a module length of 2.094 m, whose product is about 2.448 m/s:
U_prototype ≈ Ur × f_torsion × B_module = Ur × 1.169 × 2.094 ≈ Ur × 2.448
Plugging in the two control points: 0° corresponds to about 13 m/s and 20° to about 7.6 m/s. On the wind-force scale, 7.6 m/s is the upper edge of a Force-3 to Force-4 wind — the kind that sways branches and unfurls flags; 13 m/s is a Force-6 wind. That is, in a plant that stows at a twenty-something-degree angle, a Force-4 wind already meets the triggering condition.
It should be noted that this conversion is an order-of-magnitude extrapolation from test to prototype; a real plant is also affected by turbulence intensity, array shading, post damping, module dust accumulation and frame gaps, so the actual critical wind speed will deviate. But the relative law revealed by the W shape — 0° relatively most stable, 20° most fragile, and steep-tilt intervals stable again — was measured directly in the test and does not depend on the conversion.
Why does a larger tilt angle become more stable instead? The mechanism lies in the aerodynamic torque. When a flat plate twists about its own axis, the wind-induced torque depends on the angle between the inflow and the panel face. Near a nearly horizontal tilt, a tiny torsion produces an obvious change of angle of attack, the aerodynamic torque does positive work and pumps wind energy into the vibration; but once the panel has already rotated to a steep angle, the same angular displacement causes a smaller change of angle of attack, the aerodynamic torque no longer keeps feeding energy, and the system returns to stability.
This also explains why 20° is the trough rather than 0°. At 0° the panel is perfectly horizontal: although the angle-of-attack change is sensitive, the projected frontal area is smallest and the aerodynamic force is also smallest; at 20° it retains a substantial projected frontal area and also sits on the most sensitive slope segment of angle-of-attack change — the two effects superimpose and aerodynamic feeding is strongest. The W-shaped curve is essentially the result of these two effects trading off.
to be continue…